NOTE: We strongly recommend that you read the following topics before attempting to construct a menu for menu engineering purposes.
•How can I make Menu Engineering work for me?
•How do I interpret a menu engineering graph?
The Engineering (Table) page shows the name of the menu as entered in the General Detail page along with menu engineering details for the entire menu.
This page is largely divided into two halves. The top area of the page lists menu engineering details for the entire menu whilst the bottom area of the page shows a grid containing summary information for the menu.
The menu engineering grid at the top of the page let you enter budget and/or actual sales figures for the various items (retail ingredients and/or recipes) on your menu. The program uses these sales figures, along with the calculated costs and prices of the menu items to perform menu engineering calculations. The results of these calculations are displayed in this grid as well.
The following columns are displayed in the menu engineering grid. There are two tabs at the bottom of this grid; 'Budget', and 'Actual'. The figures displayed in the table depend on which of these tabs is selected.
Name
This is the name of the ingredients, recipes or courses entered into the menu from the Products & Prices Page.
Quantity
This is the budget or actual number of units of a particular product (depending on which tab you are in).
Cost
This column shows the unit cost for each menu item.
Price (Ex. tax)
This column shows the retail price, excluding tax, for each menu item.
Retail Unit
This column displays the unit by which you are selling menu items.
Total Cost
This column shows the total cost of production for each menu item. This is calculated by Unit Cost multiplied by the Quantity of sales.
Total Sales
This column shows the total gross revenue from each menu item.
See the following image.
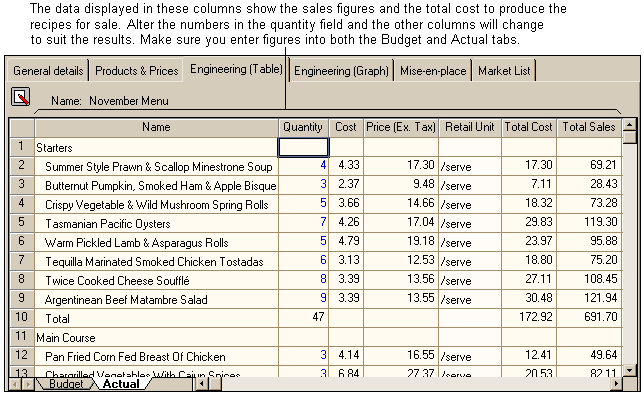
NOTE: The numerous columns in this page mean only half can be viewed at a time. We have divided the screen into two sections, but all information shown can be viewed in the program by using the scroll bar located at the bottom of the section on screen.
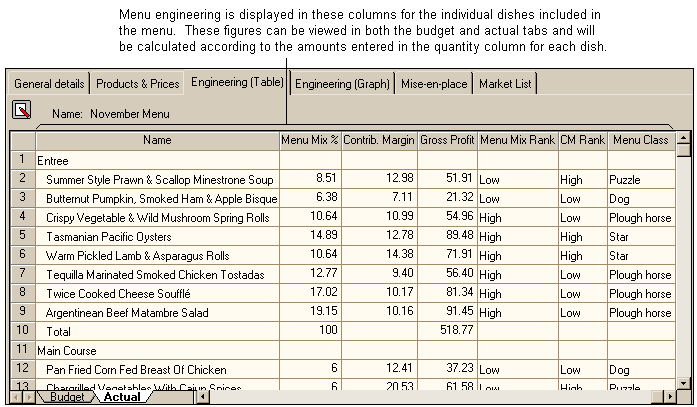
Menu Mix %
This shows the Menu Mix Percentage for each menu item. This is the sales quantity of the menu item represented as a percentage of total sales for the sub-menu. Note: For menu engineering purposes, Resort Bistro treats all menu item 'under' a particular course as a sub-menu. These sub-menus are effectively treated as separate menus for menu engineering calculations.
Contribution Margin
This is the gross profit cash contribution for a single unit of a menu item. This is defined as the production cost of the menu item subtracted from the selling price.
Gross Profit
This is the contribution margin multiplied by the total quantity of sales.
Menu Mix Rank
The Menu Mix Rank indicates the relative performance of a particular menu item within a sub-menu. Each item has a Menu Mix Rank of either 'High' or 'Low'. This is an indication of whether the item is 'pulling its weight' within a menu in terms of unit sales. If a menu item meets or exceeds a particular calculated threshold value, then its Menu Mix Rank is ranked as 'High', otherwise it is ranked as 'Low'.
This threshold criteria is defined as follows. An average sales percentage is calculated for a sub-menu. If, say, a sub-menu consists of four menu items, then in a theoretically ideal world, each item would make 25% of your sales mix. If an item's Menu Mix Percentage equals or exceeds 70% of this fictitious ideal then it is ranked as having a 'High' Menu Mix Rank.
NOTE: Just because a menu item has a low Menu Mix Rank, does not necessarily make it a 'bad' performer and worthy of deletion from your menu. If the item in question has a particularly high Gross Profit margin, then it may redeem itself in terms of Contribution Margin Rank and overall Menu Class (see CM Rank and Menu Class below) and hence, be worth keeping on the menu.
Contribution Margin Rank
This column shows the Contribution Margin Rank for each menu item. This CM Rank indicates an item's relative strength in terms of gross profitability. As for Menu Mix Rank, items are ranked as either 'High' or 'Low'. Each item's contribution margin is compared to the average contribution margin for its sub-menu. If the item's contribution margin equals or exceeds the average, then it is ranked 'High'.
NOTE: A menu item with a 'Low' CM Rank, may not necessarily be a candidate for deletion from the menu. If this item sells in particularly large quantities, then its Menu Mix Rank will be high and may make the item worth keeping on the menu. See 'Menu Class' below.
Menu Class
This indicates the overall ranking of each menu item within its sub-menu. The Menu Mix and Contribution Margin ranks are compared and each item is assigned one of the four standard menu engineering rankings: Star, Puzzle, Plough Horse, Dog. See the topic titled 'What is menu engineering?' for a full description of each of these rankings.
See the following screenshot.
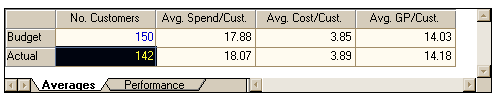
At the bottom of this page is the averages or summary grid. This grid lists calculated averages for the menu and also some summary information. Each of the fields shown is discussed below.
Averages Summary
This tab displays information about the averages of your sales such as spend per customer, cost per customer and gross profit per customer.
Number of Customers
These 'Budget' and 'Actual' fields are for entering the estimated and actual number of customers passing through your sales outlet. These numbers are used, along with the sales mix numbers from the menu engineering grid (above) to calculate the following values.
•Average spend per customer. This is the grand total sales divided by the total number of customers. This figure is calculated from both budget and actual data and gives you an indication of how much money the average customer is spending in your outlet.
•Cost per customer. This is the total cost of production for all dishes divided by the number of customers. This figure is calculated from both budget and actual data and indicates the food-cost component for each customer.
•Gross profit per customer. This is the difference between grand total sales and total costs multiplied by the number of customers. This figure is calculated from both budget and actual data and indicates how much gross profit you can expect to make for each customer entering your outlet.
See the following image.
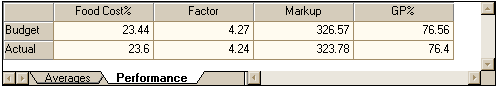
Performance Summary
This tab displays information about the overall performance of your menu. This is based on the sales figures entered into the menu engineering grid (above).
See the image below.